| Exercise | Rasters and GeoDatabase |
| Overall Goal | To load raster data into a GeoDatabase as both a moasic and as a Tile Raster dataset |
| Demonstrates | How FME can read in a series of rasters and produce a mosaic from the inputs as either as seamless image or as a tiled dataset |
| Completed Workspace | C:\FMEData2020\Workspaces\IMGS_ArcGIS\FME_Raster_GeoDatabase_Complete.fmw |
This exercise will look at how FME can load raster data such as aerial imagery, terrain or raster maps into a GeoDatabase. This data can be loaded to create either a single mosaic of the images or a tiled dataset that displays as a single image but retains links back to the individual tiles.
1) Create a New Blank Workspace
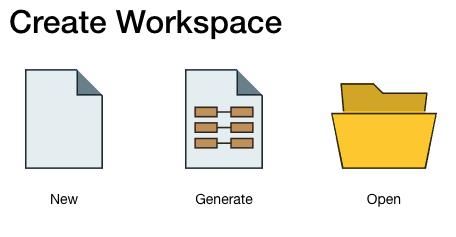
Open FME Desktop and select New to create a new blank canvas.
2) Add a GeoTIFF Reader
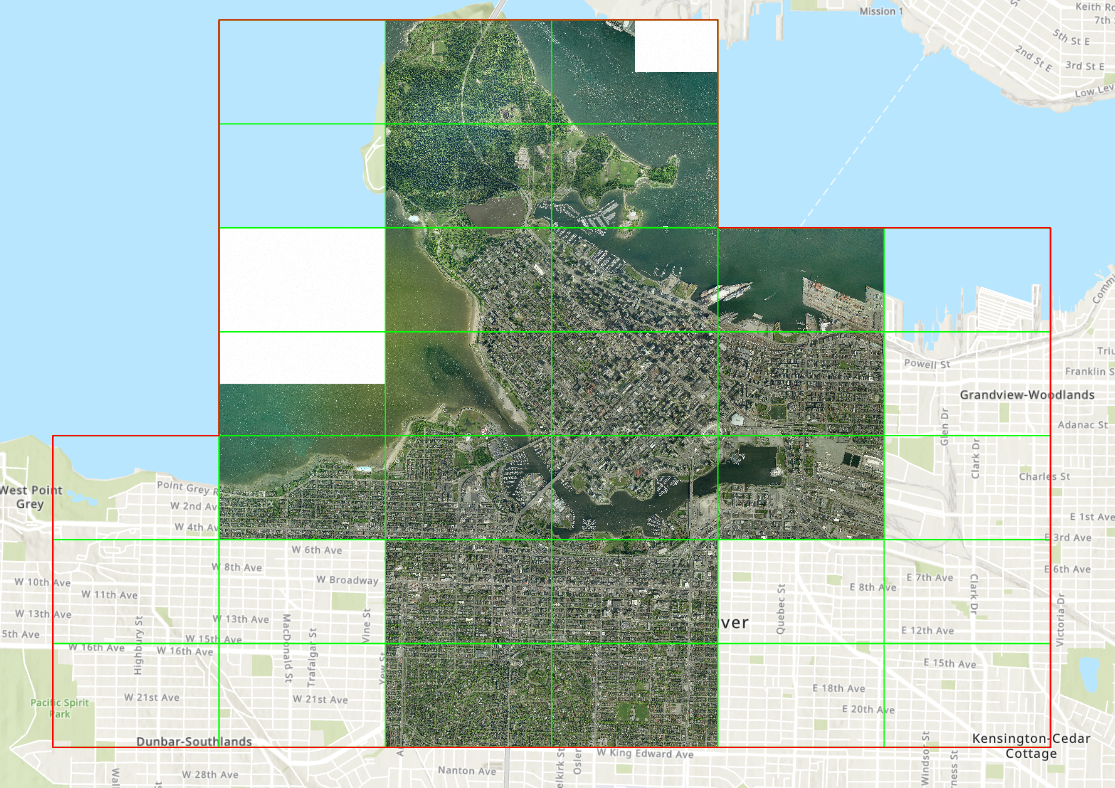
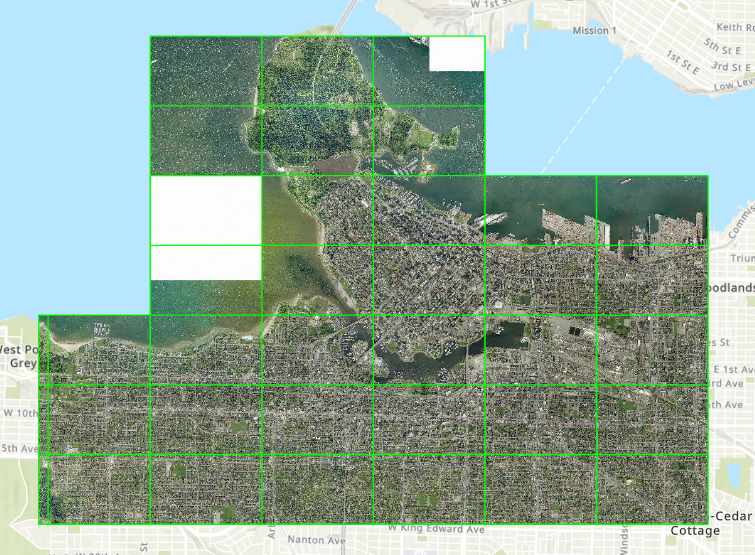
Our source GeoTIFFs are 40 individual tiles covering downtown Vancouver. The first step is to bring all of these tiles into the workspace.
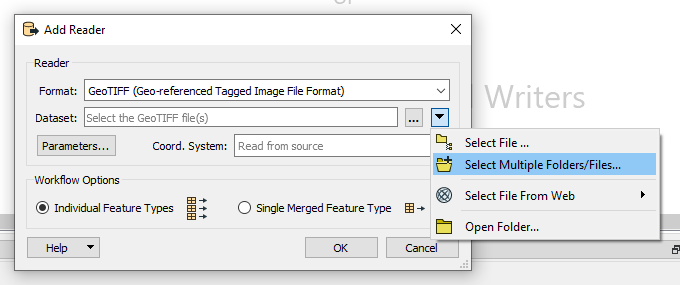
Add a GeoTIFF reader and select the drop down menu from the Dataset option. Under this choose Select Multiple Folders/Files.
From this menu select Add Folders. Then Navigate to C:\FMEData2019\Data\Orthophotos and add this folder.
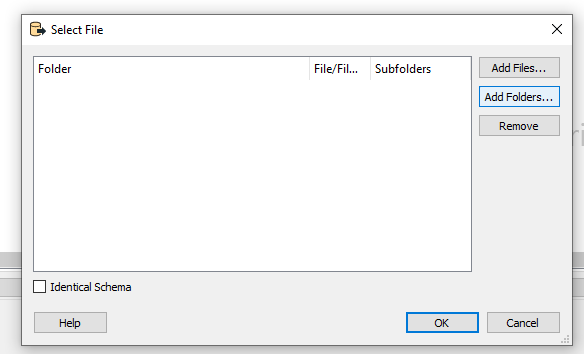
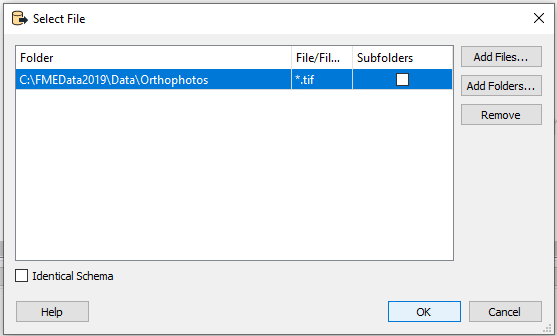
This will add the path and all of the valid file extensions. Our data only has *.tif so highlight all the layers and remove these.
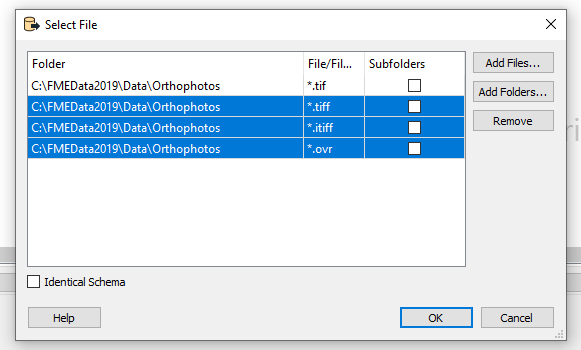
The final result should look like the below. Click on OK to close the menu and add the data to the canvas.
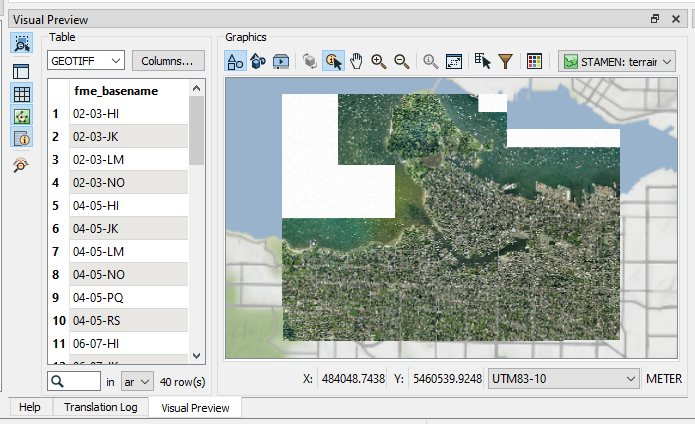
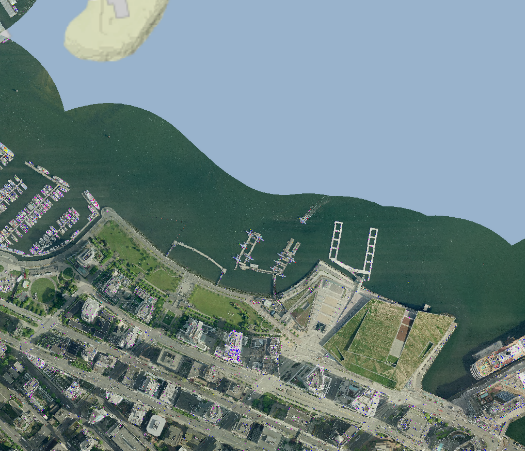
Once the data is added, run the GeoTIFF feature type to read the data into the workspace. Click on the inspect icon to visualise the data in the Visual Preview. It should look like below.
2) Resample for Performance
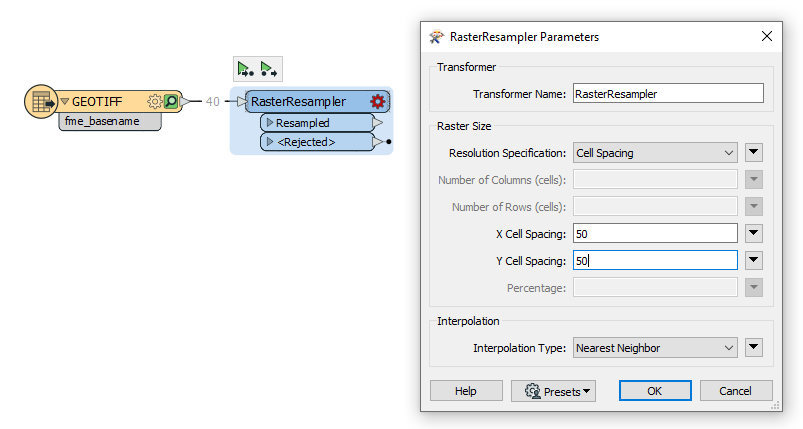
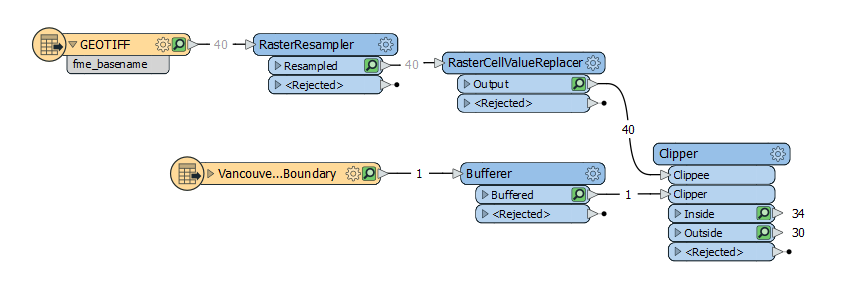
Much like we would use a Sampler transformer to reduce the data volume for testing purposes we can use the RasterResampler to simplify the data for testing. Add a RasterResampler transformer and connect it to the GeoTIFF feature type.
Configure the Resolution Specification parameter to Cell Spacing and set the X and Y Cell Spacing to 50. This will resample the image so that it has a resolution of 50m which will make it quicker to work with in the following steps.
3) Fix the Image Noise
The data has been stored in a lossy format at some point in its life, and this has resulted in noise being introduced in the areas that should be transparent. To help clean this up we can replace all the pixel values that are noise with the correct no data values.
From integrating the raster we can work out that we need to replace all values above 240 in each of the bands of the raster. Our raster is 8bit so has a range of 0 to 255 in each of its three bands (Red, Green and Blue).
Add a RasterCellValueReplacer transformer connected to the Resampled port of the RasterResampler. Configure as follows.
| Parameter | Value |
|---|---|
| Replace Values >= | 240 |
| Replace Values <= | 255 |
| New Value | 0 |
| Replace Nodata | Yes |
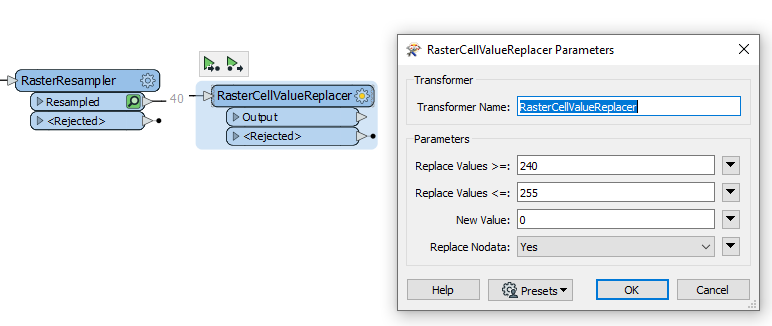
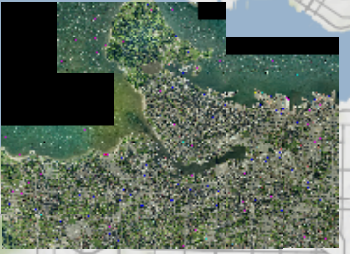
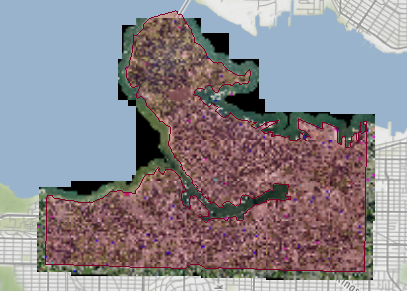
Run the transformer and you will see that the white areas are replaced with solid black that will not contain the same speckle noise.
4) Clip to the City Boundary
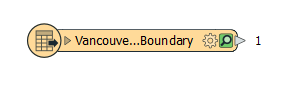
To further improve the data presentation and to only keep the area of data we need we can clip the data back to a buffer of the city boundary. To do this add a Shapefile reader and add the following shapefile to the canvas.
C:\FMEData2019\Data\Boundaries\LandBoundary\VancouverLandBoundary.shp
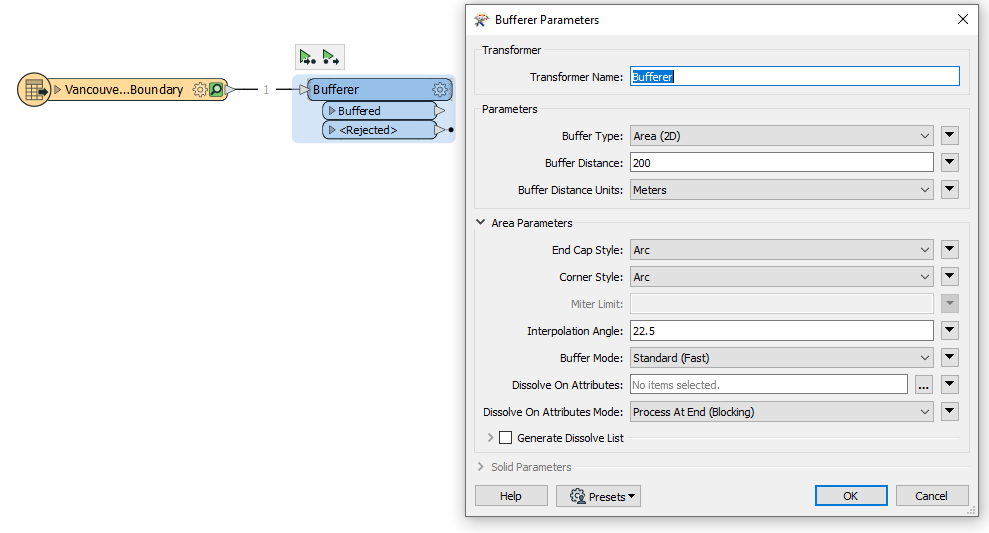
To this feature type connect a Bufferer transformer. Set its Buffer Distance to 200 and the Buffer Distance Units to meters to apply a 200m buffer to the boundary.
Add a Clipper transformer and connect the Clippee port to the RasterCellValueReplacer and the Clipper port to the Bufferer transformer. This will clip our raster dataset against the buffered boundary.
Run the transformer and review the results of the Inside and Outside ports to see the impact of the clip operation. You'll see that whilst we still have the squared black boundary our actual data now follows the buffered boundary. In the visual previews you can shift select multiple cache points, so you can select the bufferer output and the inside clip output to see both together. If the image overlays the polygon you can use the layer control to drag the polygon above the image.
5) Set the Nodata Values
The current output is still not very pretty and whilst the black bounding boxes are the result of the nature of raster data they obscure the map underneath. We can therefore set the Nodata value to make these areas transparent.
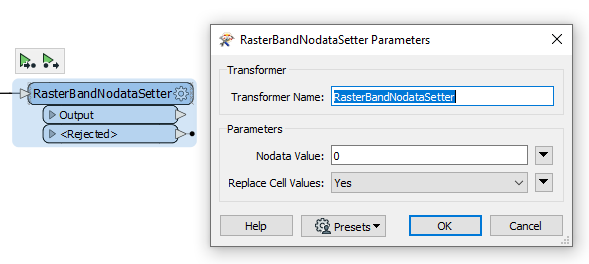
Add a RasterBandNodataSetter transformer and set the Nodata value to 0 and the Replace Cell Values to Yes.
The data should now look like this.
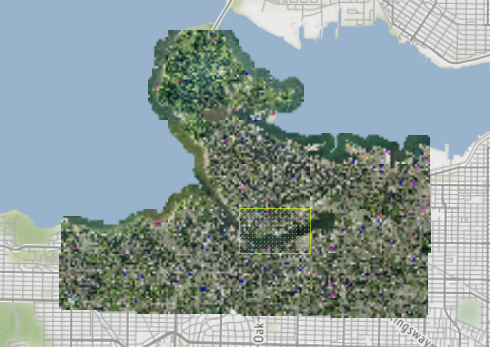
You should be able to zoom in to the data now to see more detail, and the see the underlying map at the image data edge.
6) Add GeoDatabase Mosaic Writer
We want to take our individual tiles of information and turn these into a single mosaic layer. To do this add a Esri Geodatabase (File Geodb Raster Dataset) writer and configure the output to
C:\FMEData2020\Output\Training\Vancouver_Moasic.gdb

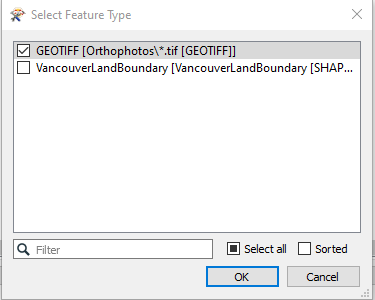
Select the GeoTIFF Feature type when prompted.
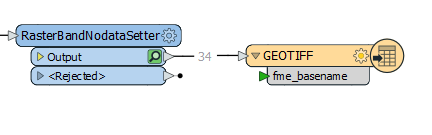
Connect the GeoTIFF feature type to the RasterBandNodataSetter transformer.
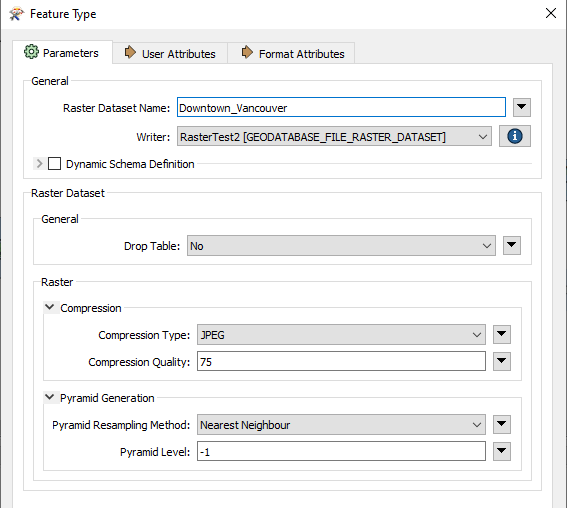
Open the GeoTIFF feature type parameters and configure as below. Setting the Pyramid Level to -1 tells FME to optimise the generation of the pyramids when creating the data. The Compression Quality ensures the quality of the imagery, and set the Compression Type too JPEG to use JPEG compression which is optimal for aerial imagery.
7) Update the Resampler, run the workspace and review the output in ArcGIS Pro
Update the Resampler to 5m, this will give better image quality but still be quick to process.
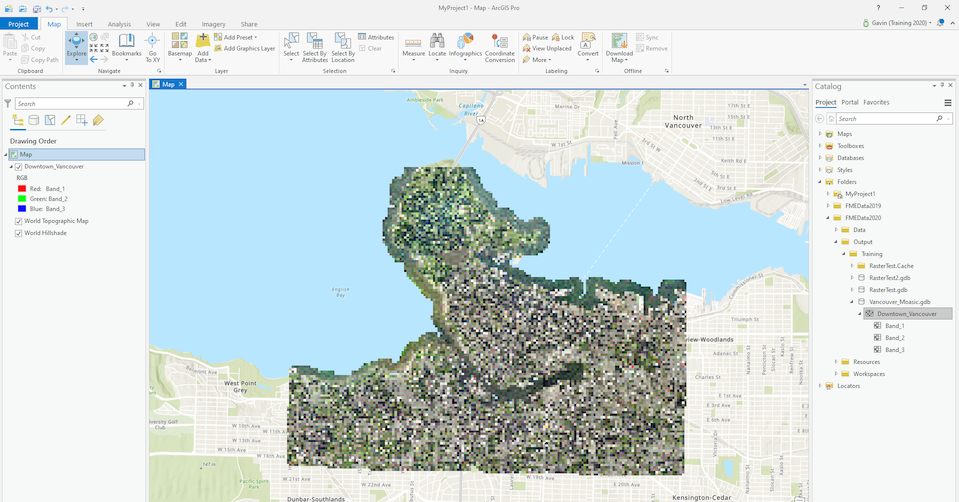
Run the Workspace to create the GeoDatabase and then open up the resulting mosaic image in ArcGIS Pro.
8) Create a Tiled Layer
The above creates a mosaic layer in the GeoDatabase it is also possible to create a File Moasic using the GeoDatabase file writer.
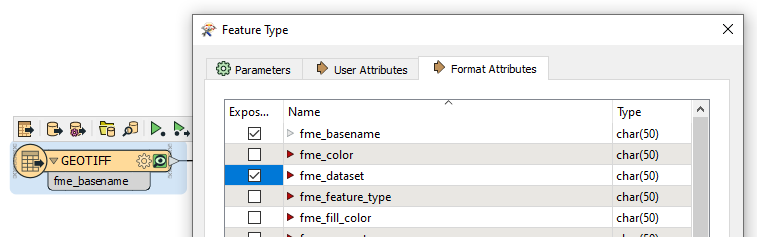
To do this we need the file paths for the images. We can get this from the fme_dataset format attribute on the GeoTIFFs. To enable this go to the GeoTIFF reader and to the Format Attributes tab of the feature type settings.
Tick on fme_dataset to expose the attribute.
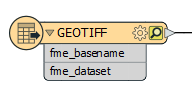
This will expose the attribute on to the canvas and you can see from the visual preview this contains the path to the data.
The cache until the RasterBandNodataSetter is now invalid so go to this transformer and rerun to this point to rebuild the cache with the new attribute.
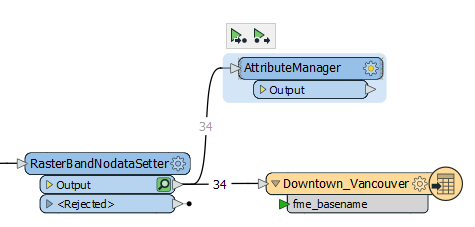
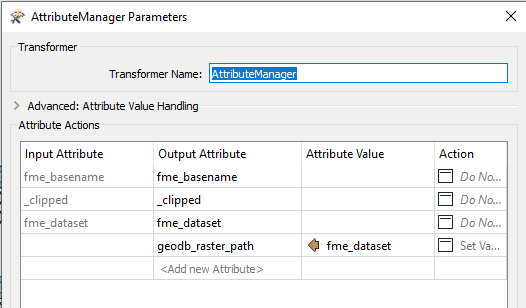
Connect an AttributeManager to the RasterBandNodataSetter as shown below.
Inside the AttributeManager create a new attribute called geodb_raster_path and set its value to be the fme_dataset attribute. This attribute is used by the GeoDatabase to locate the image tiles.
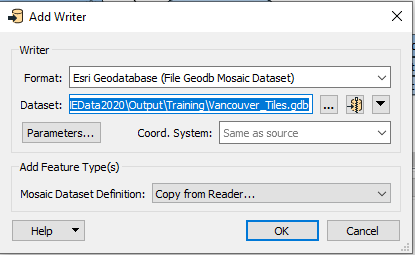
Add a Esri Geodatabase (File Geodb Mosaic Dataset) writer and set the output to C:\FMEData2020\Output\Training\Vancouver_Tiles.gdb.
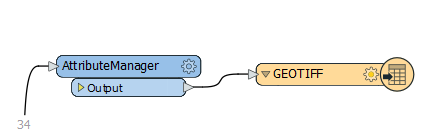
Connect the output feature type to the AttributeManager.
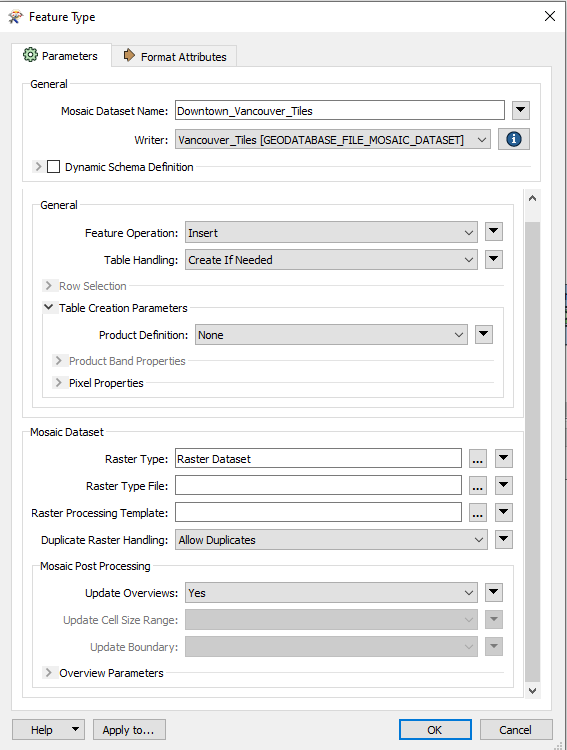
Configure the output Feature type as shown below, setting the mosaic name and setting the Raster Type to Raster Dataset. Then set Update Overviews to Yes. This tells the GeoDatabase it is loading a raster image and to pre-build the overviews for the dataset to aid performance in ArcGIS Pro.
Run the Workspace and view the data in ArcGIS Pro. You can also compare the file sizes of the two geodatabases. The mosaic source is larger as it holds all of the raster data whilst the tiled is smaller as it just holds the references to the images.
You will see the images, the bounding box and the tile footprints. You will also notice that because we are pointing at the source data we do not see the clipped and corrected data that we have generated. (See advanced task)
9) Remove the RasterResampler and ReRun
Now we are confident that the core of our raster workflow works, we can remove the RasterResampler and run the workspace again to generate our image at full resolution.
Delete the GeoDatabase we just created and then simply delete the RasterResampler transformer and then run the workspace again.
This will take longer to process as we are now using the full imagery, which means that the pyramids and mosaic operations will all take longer. It should take approximately 10 minutes to populate the mosaic.
| Advanced Task |
|
Using your skills with FME can you cut the cleaned and clipped data we created in the main body of this exercise and write out a new set of image tiles that can be imported into the Tiled GeoDatabase instead of the original source tiles. |
| CONGRATULATIONS |
|
The tasks above demonstrate how to process raster data within FME and then write it to a GeoDatabase for use in ArcGIS Pro, either as tiled data or as an image mosaic. |